Here is house edge explained in a single sentence: it is the gap between the payout a game offers you and the payout a fair bet on that same outcome would have to offer, expressed as a percentage of every unit you stake. That gap is not a fee added on at the end, not a reaction to how you are doing, and not something a staking pattern can file down.
It is baked into the payout rule itself, which is why it can be derived with nothing more than arithmetic – no insider knowledge, no leaked paytables, no vendor marketing. Most pages on this topic either garble the formula or quietly turn it into a shopping list of “low-edge picks”, which misses the point entirely. The arithmetic below is worked out from first principles so you can check it yourself, and the conclusion it leads to is uncomfortable rather than encouraging. 18+. Real-money play carries risk, and loss is the expected outcome over time.
Table of Contents
House edge explained in one short answer
The margin exists because games pay out less than the true odds of the thing they are paying on. If an outcome happens once in every four attempts, a fair bet would return four times your stake. Pay three and a half times instead, and you have created a margin. Everything else – the wheel, the reels, the cards, the countdown timer on a colour round – is presentation layered over that one subtraction. Everything above is the house edge explained from first principles.
Expressed formally, the figure is the average amount the operator keeps per unit staked, over a very large number of identical bets. A 2% margin means that across a million units wagered on that bet type, roughly 20,000 units are retained and roughly 980,000 are returned as winnings. It says nothing about any individual bet, any individual session, or any individual day. It is a long-run average and should never be read as a prediction about tonight.
Three properties follow immediately, and they are the three that marketing material tends to leave out:
- It is a property of the bet, not of the player. Two people making the same bet face the same margin regardless of experience, bankroll or mood.
- It does not reset, warm up or cool down. Each round is resolved by the same payout rule as the last one, so the figure is identical on round one and round ten thousand.
- It compounds with volume, not with time. Expected loss scales with total amount staked. Ten thousand small bets expose you to more expected loss than ten large ones of the same unit size.
That third point is the one most often missed. People assume that playing smaller protects them. It protects them from large single swings, which is real, but it usually increases the number of rounds played – and the number of rounds is what multiplies the margin into a total.
It is also worth separating the margin from two things it is frequently confused with. It is not an operator’s profit margin, because a set of accounts includes costs, taxes and marketing that have nothing to do with the payout rule. And it is not the same as the proportion of players who finish a session down, which is a different statistic driven mostly by how widely results scatter. The margin is a narrow, precise quantity: payout offered against payout deserved, per unit staked, nothing more.
How the edge is built: payout versus true probability
Take a wheel with 37 pockets – the numbers 1 to 36 plus a single zero. Bet on one number. The true chance of hitting it is 1 in 37. A genuinely fair payout would be 36 times your stake returned, or 35:1 in the notation tables use, plus your original unit back – because across 37 attempts you would win once and lose 36 times, and 36 units of winnings would exactly cancel 36 units of losses.
The actual payout is 35:1. One unit of the fair payout has been removed. That single missing unit, spread across all 37 possible outcomes, is the entire margin: one divided by 37, or about 2.70%. Nothing else in the game design contributes. The wheel is not weighted, the dealer is not doing anything clever, and the result does not need to be manipulated. The subtraction was performed once, in the paytable, before anyone sat down.
Now add a second zero, as some wheel layouts do. The number of pockets rises to 38, so the true chance falls to 1 in 38, but the payout stays at 35:1. A fair payout would now be 37:1, so two units of fair payout are missing rather than one. Two divided by 38 is about 5.26% – nearly double, from a single extra pocket. This is the cleanest demonstration of the whole concept: the payout did not change, the probability did, and the margin moved accordingly.
The same single-zero wheel also shows that the margin does not depend on which bet you pick, as long as the paytable is built consistently. A red-or-black bet on that wheel wins on 18 pockets out of 37 and pays 1:1. Eighteen thirty-sevenths of a unit won, nineteen thirty-sevenths lost, leaves minus one thirty-seventh – the identical 2.70%. The straight number and the even-money bet feel nothing alike and resolve at wildly different rates, yet they carry exactly the same cost per unit staked. That is the first hint that margin and volatility are independent quantities.
The same subtraction in a different costume
Colour-prediction and up-down round formats use the identical mechanism with cleaner numbers. A two-outcome round where the stated chance is one in two and the payout is 1.95 times your stake returns, on average, 0.5 multiplied by 1.95, which is 0.975 of every unit staked. The retained 0.025 is a 2.5% margin. The multiplier printed on the button – 1.95 rather than 2.00 – is the margin. There is no hidden layer to find.
This is why the posted multiplier is the only number in a prediction-style round that carries real information. A round advertising 1.98 on an even chance has a 1% margin; one advertising 1.90 has 5%; one offering a 9x payout on a one-in-ten outcome has 10%. You can read the cost straight off the button without knowing anything about the underlying number generator, provided the stated chance is the real chance. Where the stated chance cannot be checked against a published structure – pockets, faces, cards, reel strips – the arithmetic simply cannot be completed, and an uncheckable number should be treated as unknown rather than assumed fair.
How house edge is calculated, step by step
The calculation is the same four steps for any bet whose outcomes and payouts you can list. You do not need probability theory beyond multiplication and addition.
- List every distinct outcome of the bet – win, lose, push, partial return, each payout tier – with no overlaps and nothing left out.
- Attach the true probability to each outcome, derived from the game’s own structure: pockets on a wheel, faces on dice, cards in a shoe, symbols on a reel strip.
- Attach the net result of each outcome per unit staked. A 35:1 win is +35. A loss is -1. A push is 0. A payout quoted as a multiplier of 1.95 is +0.95 net, because 1.00 of that return is your own stake coming back.
- Multiply and sum. Each probability times its net result, all added together, gives the expected result per unit. Flip the sign and you have the margin.
Worked on the single-zero wheel: (1/37 multiplied by +35) plus (36/37 multiplied by -1). That is 35/37 minus 36/37, which equals -1/37, or -0.0270. The margin is 2.70%.
Worked on a banker bet in baccarat, where the win pays 0.95 net after the standard commission: the win probability is about 0.4586, the loss probability about 0.4462, and ties – about 0.0952 – return the stake with no net change. So (0.4586 multiplied by +0.95) plus (0.4462 multiplied by -1) plus (0.0952 multiplied by 0) gives about 0.4357 minus 0.4462, which is about -0.0105. Roughly 1.06%.
Worked on a two-outcome prediction round at a 1.95 multiplier: (0.5 multiplied by +0.95) plus (0.5 multiplied by -1) gives 0.475 minus 0.5, which is -0.025, or 2.50%. Three different games, three different presentations, one formula – and in each case the only inputs were numbers the game itself publishes.
Bets with several payout tiers work the same way, there are just more rows. For a draw-style or reel-style paytable you list each winning combination with its probability and its net return, multiply down the column, and add. The sum of all those products is the expected return per unit; the shortfall from 1.00 is the margin. This is essentially how a reel game’s advertised return figure is produced, which is why that figure and the margin are two statements of the same calculation rather than two independent measurements.
Two warnings about step three. First, confusing a multiplier with a net payout is the single most common arithmetic slip; a multiplier of 2.00 is a net of +1.00, not +2.00. Second, some published figures are quoted per unit resolved rather than per unit staked, which inflates them wherever pushes and ties are common. Always check which denominator a quoted percentage uses before comparing two numbers side by side.
Seven games compared: where each margin comes from
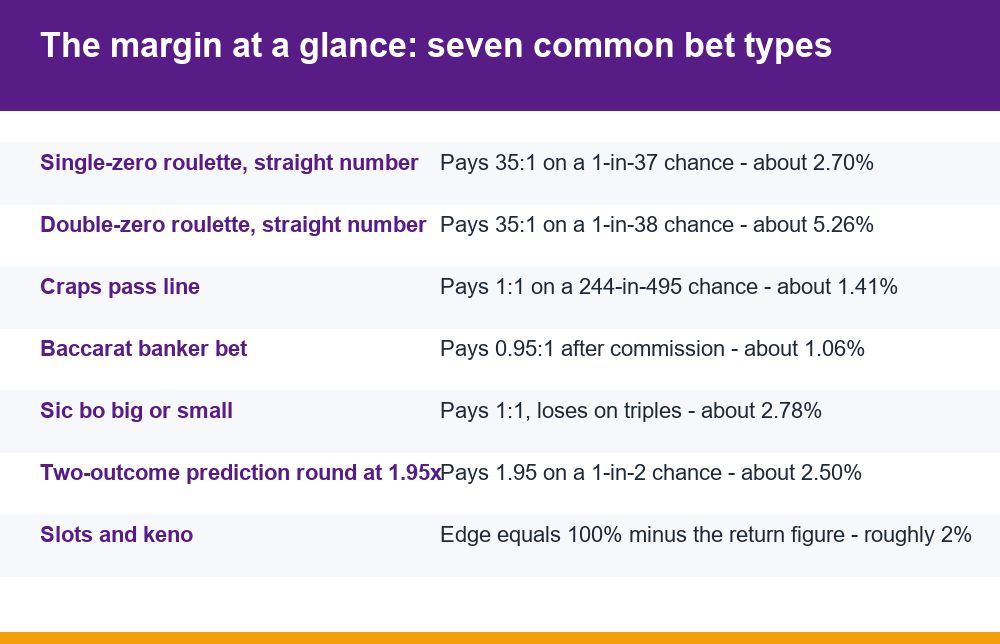
The table below shows seven common bet types with the arithmetic that produces each figure. These are illustrative derivations from standard payout rules, not a ranking and not a recommendation – specific titles and tables vary, and the point of listing them together is to show that one formula covers all of them.
| Bet type | Payout offered | True chance | Arithmetic | Margin |
|---|---|---|---|---|
| Single-zero wheel, one number | 35:1 | 1 in 37 | (35 – 36) / 37 | about 2.70% |
| Double-zero wheel, one number | 35:1 | 1 in 38 | (35 – 37) / 38 | about 5.26% |
| Craps pass line | 1:1 | 244 in 495 | 0.4929 – 0.5071 | about 1.41% |
| Baccarat banker | 0.95:1 | 0.4586 win, 0.0952 tie | 0.4357 – 0.4462 | about 1.06% |
| Sic bo big or small | 1:1 | 105 in 216 (loses on triples) | 0.4861 – 0.5139 | about 2.78% |
| Two-outcome prediction round | 1.95x stake | 1 in 2 | 1 – (0.5 x 1.95) | about 2.50% |
| Blackjack, accurate basic play | varies by hand | depends on rule set | sum over all decision branches | roughly 0.5% to 2% |
Three things are worth noticing. The sic bo figure comes entirely from one exclusion – triples lose a bet that otherwise looks like an even-money coin flip – which shows how a single rule tucked into the small print can create the whole margin. The baccarat figure comes entirely from the commission, which is the margin made visible as a line item rather than hidden in a payout ratio. And blackjack is the only entry that cannot be reduced to one line, because the margin depends on a long chain of player decisions as well as the rule set; quoted blackjack percentages always assume a specific rule configuration plus near-perfect play, and both assumptions are doing heavy lifting.
The craps entry deserves one extra line because its probability is the least obvious. The pass line resolves over a sequence of rolls rather than a single one, and the 244-in-495 figure is the result of summing the chance of winning immediately with the chance of establishing each possible point and then repeating it before a seven appears. It is a longer calculation than the others but not a different one – still a list of outcomes, their probabilities and their net results, multiplied and added.
What the table does not show, and what no table can show, is which of these is a good idea. A lower figure is not a strategy. It is a slower rate of expected loss on the same downward slope.
Is house edge the same as expected value?
They are two readings of one calculation, not two different things. Expected value is the average net result per unit staked, from the player’s side, and it is normally negative. The margin is the same number with the sign flipped and read from the operator’s side. An expected value of -0.027 per unit and a margin of 2.70% describe one fact.
The reason both terms survive is that they answer different questions naturally. Expected value scales straight to money: multiply it by your total amount staked and you get expected loss in currency. Stake 500 units across a 2.70% bet and the expected loss is about 13.5 units, regardless of how those 500 were divided up. The percentage figure, meanwhile, is better for comparing bet types without reference to any particular bankroll.
That scaling is more aggressive than it first looks, because total amount staked is a product of three numbers: rounds per hour, hours played, and average stake per round. Double any one of them and expected loss doubles. A 1% bet played for four hours at sixty rounds an hour puts 240 units through at one unit a round, for an expected loss of 2.4 units; the same bet at three units a round and 200 rounds an hour over the same four hours puts 2,400 units through, for 24 units expected. The percentage never moved. Only the volume did.
Where the two drift apart is in what they leave out. Neither says anything about dispersion – how widely real results scatter around the average. Two bets can carry an identical margin and feel nothing alike, because one resolves in small frequent increments and the other in rare large ones. That scatter is a separate quantity, and if you want the figure that actually governs what a session feels like, the breakdown of how variance behaves across repeated bets is the one to read alongside this. Margin tells you the direction of travel. Variance tells you how rough the road is.
One more distinction that trips people up: expected value is an average over a hypothetical infinity of repetitions, and no finite number of bets is guaranteed to land near it. The average is real as a mathematical property. It is not a promise about any particular sequence.
Why slots usually carry a higher margin than table games
Reel games are specified from the opposite direction. A table bet publishes its payout rule and lets the margin fall out of it; a reel game is designed around a target return percentage and the symbol weights and paytable are then constructed to deliver it. The margin is simply 100% minus that return figure, so a title built to a 96% target carries a 4% margin by definition. The band across the category is wide – roughly 2% at the tight end to well over 10% on some formats – and keno-style draw games sit higher still, often somewhere in the 20% to 30% region.
Three structural reasons push the category upward rather than downward:
- No player decisions to price around. A table game designer has to assume the player might play well. A reel game has no decision points to hedge against, so the target return can be set wherever the designer chooses without worrying about skilled play eroding it.
- Very high round frequency. Rounds resolve in seconds. The number of rounds per hour is often an order of magnitude above a table, which multiplies the same percentage into a far larger total.
- Features change dispersion, not direction. Free rounds, hold-and-spin mechanics, multipliers and jackpot tiers redistribute when returns arrive. They are already counted inside the target return figure. They do not add to it.
That last point deserves emphasis because feature marketing implies the opposite. A bonus round is not extra value sitting on top of the base game – it is part of the advertised return, moved into a rarer and larger lump. Because the published figure is a long-run average over an enormous number of rounds, a single session can land nowhere near it in either direction. The mechanics of that number, and why a quoted percentage says much less about a short session than people assume, are covered in the piece on what a return-to-player figure actually measures.
Comparing a reel game’s figure to a table bet’s figure also has a hidden trap: they are rarely measured over comparable volume. A 4% margin at 600 rounds per hour produces far more expected loss than a 1.4% margin at 40 rounds per hour, even though the percentages look only about three times apart. In that example the gap in expected loss per hour is not three-fold but roughly forty-fold, and nothing about the two advertised percentages signals it.
One further wrinkle: some reel titles ship with more than one configurable return setting, so two copies of the same game under the same name can carry different margins. Where that is the case, the only defensible position is that the percentage is unknown unless the specific configuration in front of you is disclosed. Treating a figure found elsewhere as though it applies to the copy you are looking at is an assumption, not a measurement.
Does a big win change the edge, and can the long run be beaten?
No, and no. A large win changes your balance. It changes nothing about the payout rule that will resolve your next bet. The wheel has the same pockets, the dice have the same faces, the reel strips have the same symbol weights, and the prediction round pays the same multiplier. The percentage is computed from that structure, and your recent results are not an input to it.
The mistake underneath this is treating independent events as though they were drawing from a fixed pool that has been partly used up. If a game is independent round to round – and most of these are, by design – then past results carry no information about future ones. A run of ten losses does not make a win more likely. A large win does not make the game more likely to “take it back”. There is no reservoir and no memory. There is only the same subtraction, repeated.
As for the long run, the direction of the argument is worth stating carefully. The margin is not beaten by playing well, because playing well in these games means at most avoiding the worse bets and the worse decisions – it does not reverse the sign of the expected value. There is no staking pattern, progression, recovery sequence or bet-sizing scheme that converts a negative expectation into a positive one. The reason is purely arithmetic: a sum of negative expectations is negative no matter what sizes you choose, because multiplying a negative average by a bigger or smaller number cannot make it positive.
What staking schemes actually do is reshape the distribution of outcomes. A doubling-up pattern converts many small wins into one rare catastrophic loss, so it produces a high probability of a small gain and a low probability of a very large loss. The average is unchanged. This is why the stance here is that no system beats the margin – not as a slogan, but because the arithmetic forecloses it. Anyone presenting a method that does is either measuring over too few rounds to detect the drift, or selling something.
It is worth being concrete about how slowly the drift becomes visible, because this is what makes short-run evidence so misleading. On an even-money bet carrying a margin of a couple of per cent, the expected drift after a few hundred rounds is a handful of units, while the ordinary random scatter over the same stretch is several times larger. The signal is buried inside the noise at that length. It only emerges when the number of rounds grows large enough for the scatter, which grows roughly with the square root of the count, to fall behind the drift, which grows in direct proportion to it. That crossover is why a winning week proves nothing and why a long record proves rather a lot.
The honest summary: over enough volume, results converge toward the negative average, and the margin is the rate of that convergence. Short runs are dominated by scatter, which is exactly why short runs are such poor evidence about anything.
House edge explained: eight mistakes to avoid when reading the numbers
Most of the confusion around this topic comes from a small set of repeated errors. Each of these appears regularly on pages that claim to explain the subject.
- Reading the percentage as a loss per session. A 2% figure does not mean you lose 2% of your deposit. It means 2% of total amount staked, and amount staked is usually a large multiple of what was deposited.
- Comparing percentages without comparing round frequency. The figure per round is meaningless until you multiply by rounds played. Fast games magnify small percentages.
- Treating a multiplier as a net payout. A 1.95x return is +0.95 net. Forgetting that your own stake is inside the multiplier makes a losing bet look like a winning one.
- Assuming the figure moves with results. It is fixed by the payout rule. Winning does not raise it and losing does not lower it.
- Confusing margin with dispersion. Two bets at the same percentage can feel entirely different. Low margin does not mean low volatility, and sometimes means the opposite.
- Trusting a figure without its rule set. Blackjack and other decision-based games only have a quotable number once the specific rules and a specific standard of play are pinned down.
- Mixing per-unit-staked and per-unit-resolved figures. Games with frequent pushes or ties produce two different valid percentages. Comparing one to the other is not a comparison.
- Treating a low figure as a reason to play. A smaller margin is a slower rate of expected loss. It is not an advantage and does not become one at volume.
A ninth error sits slightly outside the list because it is about sourcing rather than arithmetic: accepting a percentage that nobody has derived. A figure is only as good as the structure it was computed from. If a page quotes a number without the outcome list, the probabilities and the payouts that produced it, the number is a claim rather than a calculation, and the four steps above are the only way to check it.
There is also a category of claim that no amount of arithmetic supports: promised guaranteed returns, paid “prediction” feeds, recovery schemes that ask for a deposit to unlock a withdrawal, and bonus or code mechanics with wagering conditions that make the stated value unreachable in practice. These are described here only so they can be recognised. The arithmetic above explains exactly why none of them can work: every one of them claims to reverse a sign that is fixed in the paytable.
What to track instead of hunting for a low margin
If the percentage is fixed and no method moves it, the only quantity you actually control is total amount staked. That makes record-keeping the one genuinely useful analytical habit in this area – not because records improve results, but because they replace a vague impression with a number.
A minimal record needs four fields per session:
- Date. Enough to see frequency and clustering over weeks rather than one night at a time.
- Total amount staked across all rounds, not the amount deposited – this is the figure the margin multiplies.
- Net result in currency, written down when the session ends rather than reconstructed later.
- Approximate number of rounds. Rough is fine; it is what converts a percentage into a cost per hour.
From amount staked and the published figure you can compute expected loss and compare it to your actual result. That comparison is the only honest measure of how a session went, and it is almost always less flattering than memory. People remember net result and forget amount staked, which is why a session that staked twenty times the deposit and finished slightly down gets filed as “roughly break-even” when the arithmetic says otherwise.
Two further habits make the record usable rather than decorative. Log every session, including the short ones, because selective logging reproduces exactly the bias the log was meant to remove. And set the limits before the session rather than during it, since limits chosen mid-session are chosen by whoever is currently winning or losing. The practical structure for both is set out in the notes on keeping session records that survive a losing run.
One last line, and it is the whole point of the arithmetic. The margin is not a problem to be solved. It is a fixed cost of participation, disclosed in the payout rule, and the only variable on your side of the equation is how much you put through it. If the record starts showing amounts staked you did not intend, or chasing after a losing run, or borrowed money in play, that is a signal about behaviour rather than about maths – and free, confidential support is available around the clock through the National Gambling Helpline operated by GamCare.
The numbers in this piece are worth checking yourself with a calculator. They will come out the same every time, which is precisely the problem. That is the whole of house edge explained: a fixed gap between what a bet pays and what it is worth.
Frequently Asked Questions
What does house edge actually mean?
It is the average share of every unit staked that the operator retains over a very large number of identical bets, created by paying out less than the true odds of the outcome. A 2% figure means roughly 20,000 units kept per million staked. It describes a long-run average across huge volume and says nothing about any single bet, session or day.
How is house edge calculated?
List every outcome of the bet, attach its true probability from the game’s own structure, attach its net result per unit staked, then multiply each pair and add them up. Flip the sign of the total. On a single-zero wheel: (1/37 x +35) + (36/37 x -1) = -1/37, or about 2.70%. Remember that a win is net of your stake, so a 1.95x multiplier is +0.95 rather than +1.95.
Is house edge the same as expected value?
They are the same calculation read from opposite sides. Expected value is the average net result per unit staked from the player’s position, normally negative; the margin is that number with the sign reversed. Expected value converts straight to currency when multiplied by total amount staked, while the percentage is easier for comparing bet types. Neither one describes dispersion, which is a separate quantity.
Can you beat the house edge in the long run?
No. No staking plan, progression or recovery sequence can turn a negative expectation positive, because multiplying a negative average by larger or smaller stake sizes still leaves it negative. Staking schemes only reshape the distribution of results – a doubling pattern trades many small wins for one rare large loss while the average stays identical. Over enough volume, results drift toward that negative average.
Why do slots have a higher house edge than table games?
Reel games are specified from a target return percentage rather than from a payout ratio, so the margin is whatever 100% minus that target happens to be. There are no player decisions for the designer to price around, round frequency is far higher than at a table, and bonus features are already counted inside the advertised return rather than added on top. The category band runs roughly from 2% to well over 10%, with draw-style games higher again.
Does a big win change the house edge?
No. A win changes your balance and nothing else. The pockets, faces, symbol weights and payout multipliers that determine the figure are unchanged, and your recent results are not an input to the calculation. In independent games there is no pool being used up and no memory of past rounds, so a large win does not make the game more likely to claw anything back, and a losing run does not make a win due.