You tap the information panel on a casino game, see 96% RTP, and the number immediately starts doing work in your head that it was never designed to do — which is why return to player explained honestly is worth more than the one-line version most pages offer. Ninety-six per cent sounds generous. It sounds like a floor. It sounds, if you read it quickly, like a statement about tonight. It is none of those things.
RTP is an engineering figure: a long-run average produced by modelling a game over a number of rounds no human will ever play, and it says almost nothing about what happens in the next hour. This breakdown works through what the figure is actually measuring, why it is not a hit rate, how volatility changes what the same percentage feels like, and why the same game title can carry more than one RTP setting. It also names the places where RTP talk quietly turns into a sales pitch. 18+ only. Real-money play carries risk, and over time losses are the expected outcome of any margin-bearing game.
Table of Contents
What 96% RTP actually means
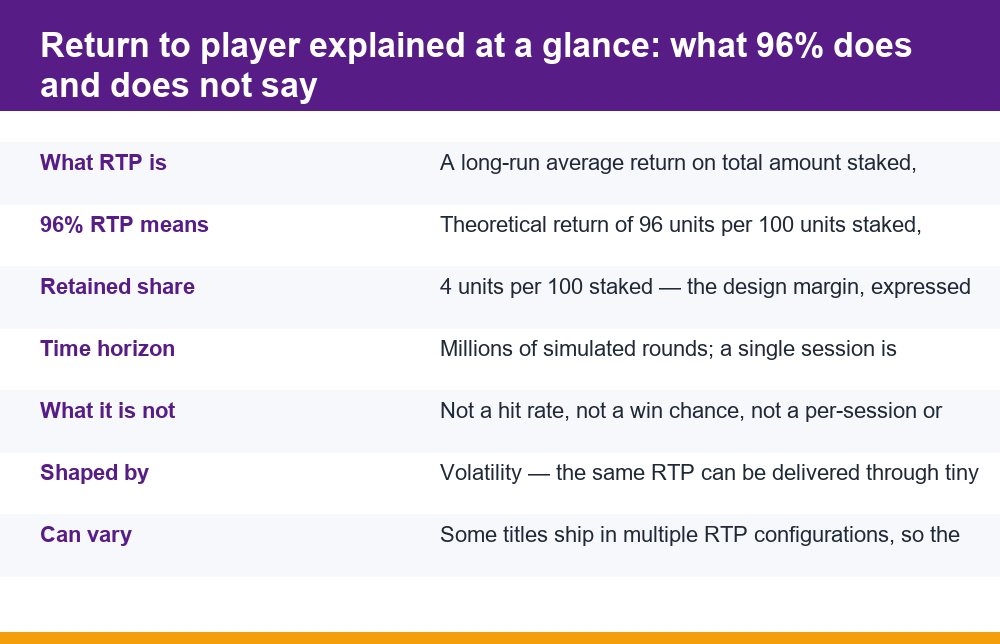
Return to player is a ratio. It compares the total amount a game is modelled to pay back to players against the total amount staked into it. A 96% figure means that for every 100 units wagered across the game’s modelled lifetime, 96 units flow back out as winnings and 4 units are retained as the design margin. The denominator is the key detail and the one most often glossed over: it is total amount staked, not total amount deposited, and not the amount you walked in with.
That distinction matters enormously in practice. If you deposit 1,000 units and bet 20 units a spin, you can stake far more than 1,000 units in a session, because returned money gets re-staked. A player who recycles their balance five times has put 5,000 units through the game, and the theoretical 4% margin applies to all 5,000 — roughly 200 units of expected cost, not 40. The RTP percentage is stable; the amount of money it is applied to is entirely determined by how much turnover you generate.
The figure is also produced by simulation or by exact mathematical derivation of the game’s paytable and reel or card structure, not by observing real players. A game’s designer knows the full probability distribution of every outcome, multiplies each payout by its probability, sums the result, and divides by the stake. That arithmetic gives a single number. It is correct in the same way that the long-run average of a fair coin is 0.5 heads per flip — correct as a limit, and not a description of any particular ten flips.
It is worth being precise about what kind of statement that makes it. Return to player explained at its simplest is a claim about a model, not a measurement of a population. The designer is describing a property they built in deliberately, the way a manufacturer states a component tolerance. That is why the figure is stable and quotable, and also why it carries no information about any individual run of the product. A tolerance tells you how a part was specified; it does not tell you what the next part off the line will measure.
Here is the arithmetic laid out. These are not predictions and not observed results; they are simply what the 96% ratio implies about turnover if variance is set aside, which is exactly the simplification that makes the number misleading when quoted alone.
| Total staked (turnover) | Theoretical return at 96% | Theoretical margin retained |
|---|---|---|
| 1,000 | 960 | 40 |
| 10,000 | 9,600 | 400 |
| 100,000 | 96,000 | 4,000 |
| 1,000,000 | 960,000 | 40,000 |
Read the table in both directions. Going down, the theoretical cost of play scales with turnover, which is why the practical lever on expected cost is how much you stake in total, not which percentage is printed on the panel. Going up, notice that at the top rows the real outcome can sit a very long way from the theoretical one, because variance has not yet averaged out. The bottom row is where the design figure genuinely starts to describe reality — and nobody plays the bottom row.
Return to player explained as a long-run average, not a session promise
The single most common misreading is treating RTP as a per-session expectation. In this frame, 96% becomes “I should get back about 96% of what I put in tonight, so a 500-unit session should cost me about 20 units.” That is not what the number says, and the gap is not a rounding error — it is the whole story.
RTP converges over the number of rounds used to model it, which for a typical slot is measured in the millions or tens of millions. A long human session might be a few hundred rounds. At that sample size, the distribution of possible outcomes is extremely wide: the most likely single result is not “return 96% of turnover” but “return substantially less than you staked”, with a thin tail of sessions where a large payout lands and the result is well above 100%. The average of all those sessions trends toward 96%; your session is one draw from a lopsided distribution, not an instalment of the average.
This is the same structural point that applies to every margin-bearing product, which is why it is worth reading alongside the arithmetic in our breakdown of how house edge turns a small design margin into a reliable long-run cost. The mechanism is identical; only the vocabulary changes between game types.
There is a second, subtler problem with the session reading. Averages are only useful as forecasts when the quantity being averaged is roughly symmetric. Game returns are not. A small number of very large payouts carry a meaningful share of the total return, which means the typical session sits below the average and a few sessions sit far above it. Quoting the mean without the shape of the distribution is technically accurate and practically misleading. When a page tells you 96% and stops, it has told you the least useful true thing available.
It helps to notice what the convergence actually depends on. The long-run average is reached by accumulating rounds, and rounds accumulate only through staking. There is no mechanism by which a game tracks how far a player sits from the average and nudges them back toward it, because each round is drawn independently from the same distribution. The average is a property of the aggregate of all rounds ever played on the product, by everyone, pooled. You are not working through your own private copy of that average; you are contributing a handful of rounds to a pool large enough that your contribution is invisible.
That is also why aggregate reporting of realised return can sit close to the theoretical figure while almost no individual player’s record does. Pool enough turnover and variance shrinks relative to the total; look at one person’s month and variance dominates completely. Both observations are consistent, and only one of them is about you.
The honest summary: RTP is a property of the game, not a property of your evening. It tells you how the product is built. It does not tell you what will happen, how long your balance will last, or whether tonight will resemble the average in any way at all.
RTP is not hit frequency, and the two get confused constantly
Hit frequency is the proportion of rounds that return anything at all. RTP is the proportion of money returned. They are different measurements of different things, and they can move in opposite directions in the same game.
Consider two ways of building the same 96% return. In the first, most rounds pay back a small amount — often less than the stake — so the game registers a hit very frequently while steadily eroding the balance. In the second, the large majority of rounds pay nothing and the return is concentrated in rare outcomes. Both configurations can be tuned to the same RTP. One has a high hit frequency and the other a low one. A player would describe them as completely different games, and both panels would read 96%.
The confusion is made worse by the fact that a “hit” in game terminology does not mean a profitable round. A return of half your stake is still logged as a hit. A player can experience a long run of hits and a shrinking balance at the same time, which feels contradictory until you separate the two metrics.
There is a clean arithmetic relationship between the two, and seeing it makes the independence obvious. Return per unit staked equals hit frequency multiplied by the average return size per hit, measured in stake units. Hold the product constant at 0.96 and either factor can be moved freely as long as the other moves to compensate. A build that returns something on three rounds in ten needs a larger average return per hit than a build that returns something on six rounds in ten. Nothing about the printed percentage tells you which of those two factors a particular game leans on.
Three figures are worth keeping distinct in your head:
- RTP — the share of total amount staked that is modelled to return to players over the long run. A money ratio.
- Hit frequency — the share of rounds that return something, anything, including less than the stake. A count ratio, and not a measure of profit.
- Volatility — how widely individual results spread around the long-run average. The shape of the experience, not its average.
No one of those three tells you what the other two are. A page that quotes only RTP has given you one third of the structural picture, and arguably the third that matters least for understanding what a session will feel like. Hit frequency and volatility are also published far less consistently than RTP, and in many titles they are not published at all — which means the figure that is easiest to find is the one that explains the least about the experience.
Why two games with the same RTP feel completely different
Volatility is the missing variable. Two games with identical return to player can deliver that return through entirely different distributions, and the subjective experience is governed by the distribution, not the mean.
A low-volatility build returns frequently in small amounts. Balances drift rather than lurch. Sessions last longer for the same stake, swings are modest in both directions, and the experience feels controlled — which is precisely why it can be the more expensive build in practice, because a balance that lasts longer tends to generate more turnover, and turnover is what the margin is applied to. A high-volatility build does the opposite: long stretches of nothing, punctuated by occasional outcomes large enough to carry the average on their own. Balances disappear quickly or jump sharply.
Stake size interacts with this directly, and not in the way it is usually framed. Volatility is a property of the game, but what matters to a player is volatility relative to the size of their balance. The same high-variance build is a different proposition staked at a hundredth of a balance than at a tenth of one, because the number of rounds the balance can absorb before it is gone changes by an order of magnitude. That changes the range of outcomes you are likely to observe. It does not change the expected cost per unit staked, which is fixed by the margin.
This is why volatility, not RTP, is the figure that predicts how a session will feel. It is also why the comparison between game types is more about structure than about percentages. The same reasoning applies when a cricket bettor drifts into card games between matches and finds the rhythm of the maths completely unfamiliar — something we work through in our breakdown of how card-game probability differs from match betting for cricket bettors.
Here is the same point as a comparison of what each figure actually governs.
| Question you are actually asking | Figure that answers it | What RTP tells you |
|---|---|---|
| What share of my turnover returns over the long run? | RTP | Directly answers it |
| How often will a round return something? | Hit frequency | Nothing |
| How wild will the swings be? | Volatility | Nothing |
| How long will my balance last? | Volatility plus stake size | Almost nothing |
| Will I be ahead tonight? | No figure answers this | Nothing |
The last row is not a rhetorical flourish. No published figure answers it, because the answer is a draw from a distribution rather than a property of the game. Any page that implies otherwise has crossed from explanation into persuasion.
Can the same slot have different RTP on different sites?
Yes, and this is the part that most RTP articles leave out entirely. A number of game studios ship titles in multiple configurations — the same artwork, the same name, the same features, and a different underlying return setting. Which configuration a given platform runs is a commercial choice made when the game is integrated, and it is not always disclosed anywhere obvious.
The practical consequence is that “this game has 96% RTP” is not a reliable statement about a game title. It is at best a statement about one build of that title on one platform at one point in time. A review page that quotes a figure it collected from the studio’s documentation may be describing a configuration you are not playing. Settings can also change at a later integration without any visible announcement.
The only figure that applies to what is in front of you is the one in that specific game’s own information panel, read on the platform you are actually on, at the moment you are playing. Treat every other source — review sites, comparison tables, aggregator listings, forum posts — as secondhand. They are frequently out of date and they have no way of knowing which build you loaded.
Where that panel lives varies: it is usually reached through an information or paytable control inside the game itself, and the return figure is often printed in the small print at the end of the rules rather than near the top. If a build does not state a figure anywhere in its own interface, that absence is itself the most accurate information available about it, and no third-party number fills the gap.
Things worth knowing about variable configurations:
- The same title name does not guarantee the same maths across platforms or across time.
- In-game information panels are the only source tied to the build you have actually loaded.
- A quoted figure from a review or comparison page may describe a different configuration entirely.
- Configurations can be changed at re-integration, so a figure that was accurate once may not be now.
- A difference of a percentage point or two between builds changes the long-run margin meaningfully, but it does not change the direction of the long-run result.
That last point deserves emphasis because it is where RTP talk most often turns into a hook. The pitch is that hunting for higher-RTP builds converts a losing proposition into a favourable one. It does not. A build at 97% rather than 95% reduces the long-run cost per unit staked; it leaves the sign of the expectation exactly where it was. The margin gets thinner, not negative.
How return to player relates to house edge
RTP and house edge are the same quantity expressed from opposite ends. If a game returns 96% of total amount staked over the long run, it retains 4%. House edge is that retained share. The two always sum to 100%, so a 96% RTP is a 4% edge, a 97.3% RTP is a 2.7% edge, and so on. There is no additional information in one that is absent from the other.
Casino games are usually marketed in RTP terms and table games are more often discussed in edge terms, which is largely a presentational difference. A 96% return reads as a near-total refund. A 4% edge reads as a cost. Both are the same arithmetic, and the choice of framing tells you something about who is doing the quoting.
The reason the edge framing is more useful for understanding cost is that it multiplies cleanly against turnover. Four per cent of everything you stake is the theoretical cost of play, and because returned money gets re-staked, turnover is typically several times the amount deposited. A 4% edge applied to five times your deposit is a 20% theoretical cost of that deposit. The percentage on the panel looks small; the figure it is multiplied by is the one that grows.
The same turnover arithmetic is what makes promotional conditions so much more expensive than they appear, since those conditions are expressed as multiples of turnover and are then subject to the same margin on every pass. If that mechanic is new to you, our breakdown of how wagering conditions multiply turnover before anything can be withdrawn works through the arithmetic in full. It is explained there to warn, not to sell: understanding how a condition is priced is the point, and no condition structure changes the direction of the margin.
One more framing note. Edge is quoted per unit staked, not per round and not per hour. Two games with the same edge but very different round speeds impose very different costs over the same wall-clock time, because the faster game generates more turnover. Speed of play is a cost variable that neither RTP nor edge captures on its own.
Comparing edges across game families needs one further caution. In some games the amount at risk on a round is not simply the opening stake, because the rules allow or require additional commitment part-way through a round. Where that is the case, a quoted figure may be expressed against the opening stake or against total action, and those are different denominators producing different-looking percentages for the same product. When two numbers from different sources disagree, a mismatch in what the percentage is measured against is a more likely explanation than one of them being wrong.
Reading an RTP claim: a short checklist
Most of the damage RTP does is caused by what is omitted around it rather than by the figure itself. The claim, not the number, is where return to player explained goes wrong most often. When you encounter a published figure, these are the questions that separate an explanation from a pitch.
- Where did the figure come from? The game’s own information panel on the platform you are using is the only source tied to your build. Everything else is secondhand.
- Over how many rounds? If a page quotes a percentage without saying it is a long-run modelled average, it has skipped the single most important qualifier.
- What is the denominator? Return on total amount staked is a very different quantity from return on amount deposited. Pages that blur this are describing a far gentler product than the one that exists.
- Is volatility mentioned at all? A page that quotes RTP and never mentions distribution is not equipping you to understand a session.
- Is hit frequency being conflated with RTP? Phrases like “pays out 96% of the time” are a category error, not a shorthand.
- Is the number being used as a reason to play? “High RTP” as a recommendation is marketing. A thinner margin is still a margin.
- Does the page acknowledge configurable builds? Silence on this is a strong signal the figure was copied rather than checked.
If a page fails most of those, the percentage it quotes is not necessarily wrong — it is simply not doing the job the page claims it is doing. Accuracy and usefulness are separate properties, and a bare figure can be fully accurate and still leave a reader with a worse model of the product than they started with.
The same checklist works in reverse as a test of your own reasoning. If you find yourself able to state what the percentage is a ratio of, over what horizon it converges, and which two other properties it says nothing about, the figure is doing the small honest job it was built for. If you find yourself reasoning from it toward an expectation about a session, a balance or an outcome, the number has quietly been promoted into a forecast it cannot support.
For the broader context in which any of this sits — risk, time and money spent, and where to find support — the charity BeGambleAware publishes free, independent information and support for anyone affected by gambling, which is worth reading alongside the maths rather than instead of it.
Common mistakes people make with RTP
Having return to player explained properly mostly means unlearning a handful of specific errors. These are the ones that recur, and each of them is a reasonable-sounding inference from a figure that was presented without context.
- Treating 96% as a session floor. It is a limit over millions of rounds. A session of a few hundred rounds is a single draw from a wide, lopsided distribution.
- Reading it as a win probability. RTP is a money ratio. The probability of ending a session ahead is a different quantity entirely and is not published anywhere.
- Assuming a game “owes” a return. Rounds are independent. A long dry run does not raise the probability of the next outcome; the long-run average is reached by the sheer volume of rounds, not by correction.
- Applying the percentage to the deposit. The denominator is turnover. Re-staking returned money multiplies turnover, and the margin applies to every pass.
- Ignoring round speed. The same percentage costs more per hour in a faster game, because turnover accumulates faster.
- Believing RTP-hunting flips the maths. A thinner margin is cheaper per unit staked. It is still a margin, and the expected direction is unchanged.
- Trusting a third-party figure. Configurable builds mean a review’s number may describe a game you are not playing.
A less obvious error sits underneath several of those: treating the percentage as a lever rather than a label. Every one of the mistakes above involves reasoning from the figure toward an action — which game to load, how to stake, when to stop, what to expect back. The figure does not support any of that. It is a description of how a product was specified, and descriptions of specifications do not contain instructions for use.
What is left after removing those errors is modest, which is the point. Return to player is a useful piece of product information: it tells you how much margin is designed into a game per unit staked, and it lets you compare the long-run cost of one build against another. That is genuinely worth knowing. It is simply far less than the number is usually asked to carry.
The figure describes the game. It does not describe your session, it does not describe your month, and it does not describe a route to a favourable outcome. No arrangement of stakes, timing, game selection or percentage-hunting changes the sign of a margin-bearing expectation — the margin is the design, and it is applied to every unit staked regardless of how those units are arranged. Keeping that straight is most of what understanding RTP actually consists of.
Frequently Asked Questions
What does 96% RTP actually mean?
It means that over the game’s full modelled lifetime — typically millions of rounds — 96 units are returned to players for every 100 units staked, with 4 units retained as the design margin. The denominator is total amount staked, not total amount deposited, which matters because returned money gets re-staked and multiplies turnover. It is a derived long-run average produced from the game’s probability structure, not a figure observed from real sessions.
Does RTP apply to a single session?
No. RTP converges over the enormous number of rounds used to model it, and a human session of a few hundred rounds is statistically invisible at that scale. At small sample sizes the distribution of possible outcomes is very wide and lopsided: the typical session returns noticeably less than the stated percentage, with a thin tail of sessions far above it. The average of all sessions trends toward the figure; yours is a single draw.
Is RTP the same as hit frequency?
No, they measure different things. Hit frequency is the share of rounds that return anything at all, including returns smaller than the stake, while RTP is the share of staked money returned over the long run. A game can register frequent hits and still steadily reduce a balance, and two games with the same RTP can have very different hit frequencies. Phrases like ‘pays out 96% of the time’ confuse the two.
Why do two games with the same RTP feel so different?
Because volatility — the spread of individual results around the average — is a separate property and it governs the experience. A low-volatility build returns small amounts often, so balances drift and sessions last; a high-volatility build pays rarely and concentrates its return in large outcomes, so balances move sharply. Both can be tuned to the identical return percentage. Volatility, not RTP, predicts how a session will feel.
Can the same slot have different RTP on different sites?
Yes. Several studios ship titles in multiple configurations with identical artwork, name and features but different underlying return settings, and which build a platform runs is a commercial choice made at integration that is not always disclosed prominently. Settings can also change at re-integration. The only figure that applies to what you have loaded is the one in that game’s own information panel on the platform you are using.
How is RTP related to house edge?
They are the same quantity from opposite ends and always sum to 100%, so 96% RTP is a 4% house edge. With return to player explained this way, there is no extra information in one that the other lacks — only a difference in framing, with RTP reading as a refund and edge reading as a cost. The edge framing is more useful for cost because it multiplies directly against turnover, and turnover is usually several times the amount deposited.