You open a cricket match market, see 1.83 on one side and 2.00 on the other, and nothing on that screen tells you what those two numbers actually cost you — which is exactly the gap bookmaker margin explained is meant to close. Most pages on the subject give you a one-line definition of overround and then change the subject to where you might find a better price.
This breakdown does something narrower and more useful: it shows you how to turn any decimal price into a probability, how to add a whole market up, and how to read the amount it exceeds 100% as a fixed cost attached to every bet you place. No picks, no systems, no claim that the arithmetic can be beaten. Just the number, where it lives, and what it means.
Table of Contents
Where the margin hides in a cricket match market
Picture the screen in front of you during a T20 match. Two team names, two prices, a countdown clock, and perhaps a dozen side markets underneath. Nothing is labelled as a fee. There is no line that reads commission, no percentage printed anywhere, no equivalent of the interest rate on a loan agreement. The cost of doing business is folded into the prices themselves, which is why so many people bet for years without ever calculating it.
That is the first thing worth understanding about how these markets are built. A bookmaker does not charge you to place a bet and then pay out at the honest rate. It pays out at a rate slightly worse than the honest one, on every outcome, every time. The difference between the honest rate and the offered rate is the margin, and it is baked into the odds so thoroughly that it is invisible unless you deliberately go looking for it with a calculator.
The reason this matters more in cricket than in some other sports is market density. A single international fixture might carry a match-winner market, a toss market, dozens of over/under lines on team and individual totals, top batter and top bowler markets with a dozen or more selections each, and a stream of in-play prices that refresh every few balls. Each of those markets carries its own margin, and they are not all the same size. Some are tight. Some are very wide. A bettor who understands the arithmetic can tell them apart in about fifteen seconds. A bettor who does not treats them all as if they were equivalent.
The goal here is description, not advantage. Knowing the margin does not tell you who will win. It tells you the price of participation, which is a different and much more reliable piece of information. If you have read our breakdown of what the numbers behind betting markets actually demonstrate, this is the sports-betting counterpart to that argument.
Bookmaker margin explained: the one piece of arithmetic that matters
Here is the whole mechanism in four sentences. Decimal odds are a multiplier on your stake, so the reciprocal of the odds — one divided by the price — is the probability the bookmaker is implicitly selling you. Add up those reciprocals for every outcome in a complete market and an honest book would total exactly 1.00, or 100%. Real books total more than 100%. That excess is the margin.
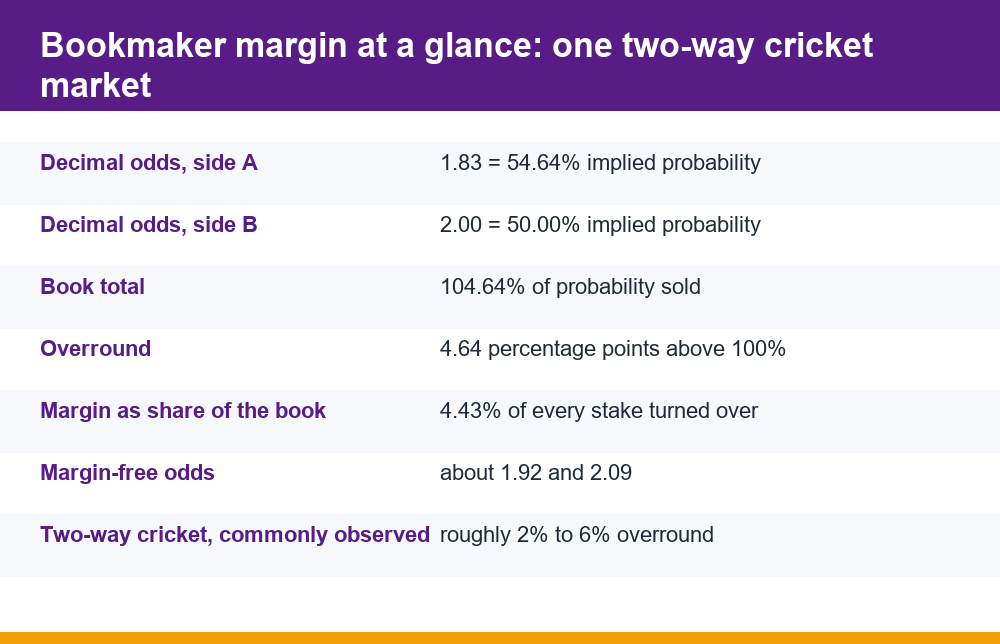
Take the two prices from the opening paragraph. One divided by 1.83 is 0.5464, so the first side is being sold to you as a 54.64% chance. One divided by 2.00 is 0.5000, a flat 50%. Added together: 104.64%. The market is selling 104.64 percentage points of probability in a situation where only 100 points exist. The extra 4.64 points are the overround, and they do not belong to either outcome. They belong to the book.
That is bookmaker margin explained with nothing left out. Everything that follows in this breakdown is either a variation on that calculation, a way of reading the result, or a correction of a common misreading. There is no second layer of hidden machinery.
Two numbers are commonly quoted from this calculation and they are not the same, which causes a lot of confusion. The overround is how far the book exceeds 100% — in this case 4.64 percentage points. The margin is usually quoted as that excess expressed as a share of the whole book: 4.64 divided by 104.64, which gives 4.43%. The second figure is the one that approximates the long-run cost per unit staked, so it is the one worth caring about. Many pages use the two terms interchangeably, and the figures they quote drift by a few tenths of a percent as a result.
- Implied probability — one divided by the decimal odds, expressed as a percentage.
- Book total — the sum of implied probabilities across every outcome in a complete market.
- Overround — the book total minus 100, in percentage points.
- Margin — the overround divided by the book total, expressed as a percentage of turnover.
- Margin-free (fair) odds — the prices you would see if the book totalled exactly 100%.
Converting decimal odds to implied probability
The conversion is a single division and it is worth doing often enough that it becomes automatic. Divide one by the decimal price, multiply by one hundred, and you have the percentage. A price of 4.00 is 25%. A price of 1.25 is 80%. A price of 2.50 is 40%. Once you can do this in your head to within a percentage point or two, every odds board you look at reads as a set of probabilities rather than a set of payout multipliers, and the bookmaker margin explained above stops being an abstraction.
This table covers prices you will meet constantly in cricket markets. The right-hand column is what the bookmaker is telling you about the outcome’s chance — with the margin still inside it.
| Decimal odds | Calculation | Implied probability |
|---|---|---|
| 1.20 | 1 ÷ 1.20 | 83.33% |
| 1.50 | 1 ÷ 1.50 | 66.67% |
| 1.83 | 1 ÷ 1.83 | 54.64% |
| 2.00 | 1 ÷ 2.00 | 50.00% |
| 2.50 | 1 ÷ 2.50 | 40.00% |
| 3.00 | 1 ÷ 3.00 | 33.33% |
| 5.00 | 1 ÷ 5.00 | 20.00% |
| 10.00 | 1 ÷ 10.00 | 10.00% |
| 21.00 | 1 ÷ 21.00 | 4.76% |
Fractional odds work the same way with one extra step: convert to decimal first by dividing the numerator by the denominator and adding one. So 5/6 becomes 0.833 plus 1, or 1.833, which is an implied 54.55% — effectively the same reading as the 1.83 line in the table. American odds need their own formula — for a negative number, divide the absolute value by itself plus one hundred; for a positive number, divide one hundred by the number plus one hundred — but decimal is the standard format in most cricket markets, so it is the one worth internalising.
One practical note: implied probability is sensitive at short prices and forgiving at long ones. Moving from 1.20 to 1.22 shifts the implied chance by well over a percentage point. Moving from 20.00 to 21.00 shifts it by about a quarter of a point. This is why short-priced markets look so static while long-priced selections appear to swing wildly for no reason. The underlying probability is not moving as much as the price movement suggests.
Why implied probabilities add up to more than 100%
A complete market covers every possible result exactly once, with no overlaps and no gaps. In a T20 that is usually two outcomes, since a tied scoreline is normally resolved by a super over in the competitions that use one and folded into one side or the other. In a Test it is usually three: home win, away win, draw. Because exactly one of those outcomes must occur, the true probabilities add to 100% by definition. There is no arrangement of reality in which they add to 104.64%.
So the excess is not a statement about cricket. It is a statement about commerce. The bookmaker sets prices so that the payouts it has promised, taken as a whole, are smaller than the stakes it has accepted. If the book balanced at exactly 100% and the money arrived in proportion to the prices, the operation would break even before any costs at all. The overround is the structural difference between what comes in and what can go out.
That makes the margin a cost rather than a prediction, and this is the point where most explanations of the subject go soft. The overround does not get refunded on a winning bet. It is not a fee deducted from your profits at the end. It is already inside the price you accepted, which means it applies to the winning bets and the losing bets equally. Over a long enough series of bets, the sum of all those small shortfalls is the reason the expected outcome of sustained betting is a loss, not a profit. The same structural logic drives the built-in edge in casino games — different presentation, identical arithmetic.
It also explains why the size of the overround varies so much between markets. More outcomes means more prices to shade, and markets that are harder to price accurately — a top batter market with fourteen names in it, say — tend to carry wider margins because the bookmaker is absorbing more uncertainty. The overround is partly a charge for the service and partly a buffer against the bookmaker’s own pricing error.
How to calculate a bookmaker’s margin, step by step
Work through it once with real numbers and you will not need the instructions again. Use a three-way Test match book for this example: 1.50 on the home side, 4.50 on the away side, 6.00 on the draw.
- List every outcome in the market. It must be complete — all three here. Leaving the draw out is the single most common error and it makes the book look far tighter than it is.
- Convert each price to implied probability. 1 ÷ 1.50 = 66.67%. 1 ÷ 4.50 = 22.22%. 1 ÷ 6.00 = 16.67%.
- Add them up. 66.67 + 22.22 + 16.67 = 105.56%. That is the book total.
- Subtract 100. 105.56 − 100 = 5.56 percentage points of overround.
- Divide the overround by the book total. 5.56 ÷ 105.56 = 0.0526, or a 5.26% margin. This is the figure that approximates the cost per unit staked.
- Write it down next to the market name. A margin you calculated and forgot is no more use than one you never calculated.
A 5.26% margin means that for every 1,000 units turned over in that market, the structure of the prices expects roughly 53 units to stay with the book. That is not a prediction about any single bet — any individual bet wins or loses in full — but it is the central tendency that turnover converges on, and the convergence gets tighter the more bets you place. Variance is what you feel in a week. Margin is what you get over a year.
Two things make this calculation go wrong in practice. The first is incomplete markets, already mentioned. The second is comparing margins across markets with different numbers of outcomes, which is like comparing the price of a kilo of rice to the price of a sack: the figures are not on the same scale. A 5% margin on a two-way market and a 5% margin on a fifteen-selection market are very different commercial propositions, and the second is unusually generous rather than equivalent.
What a typical overround looks like on a cricket match
Ranges rather than fixed numbers are the honest answer here, because the overround on any given market depends on the operator, the profile of the fixture, how much money has already been taken, and how close to the start you are looking. What follows is the general shape people tend to find when they start measuring markets themselves. Treat it as a reference for recognising an outlier, not as a published standard — nobody publishes a rate card, which is precisely why bookmaker margin explained has to be a calculation you do rather than a figure you look up.
| Market type | Outcomes | Commonly observed overround | Why it tends to sit there |
|---|---|---|---|
| Match winner, limited-overs | 2 | 2% – 6% | High liquidity, simple pricing, heavy competition |
| Match result, Test | 3 | 4% – 8% | The draw is genuinely hard to price |
| Over/under on a total | 2 | 2% – 5% | The line is adjusted instead of widening the margin |
| Toss outcome | 2 | 2% – 5% | Close to a coin flip; no pricing skill required |
| Top batter or top bowler | 11+ | 10% – 20%+ | Many selections, each carrying its own shading |
| Method of dismissal, novelty lines | 3 – 6 | 8% – 15% | Thin volume, sparse data, high uncertainty |
| In-play, during an over | 2 | 4% – 10% | Fast movement, latency risk, suspension risk |
The pattern is consistent enough to be worth stating plainly: the more outcomes a market has and the less liquid it is, the wider the margin tends to be. Headline match-winner markets on big fixtures are the shop window and are priced tightly. The long tail of side markets, props and novelty lines is where the margin widens considerably, sometimes to several times the headline figure. A bettor who reads only the match market and assumes the rest of the board is priced to the same standard is working from a badly wrong estimate of what they are paying.
In-play markets deserve a specific mention because the margin there is doing extra work. The bookmaker is pricing a situation that changes with every ball, carrying the risk that a price goes stale for a second or two, and absorbing the cost of suspending and reopening the market constantly. That risk is paid for out of a wider overround. The fast refresh rate and the sheer number of available bets are also what make in-play betting a higher-risk format in behavioural terms: the gap between deciding and committing shrinks to almost nothing, and the arithmetic you would otherwise do never gets done.
One more practical point about ranges. The same fixture can carry a noticeably different overround at different times — a wider book days out when little money has arrived, tightening as volume builds and the market has more information to price against, then widening again once play starts. If you want to measure margins meaningfully, measure the same market at the same point in its life each time. Comparing a pre-match book against an in-play book tells you about timing, not about pricing.
How to remove the margin from odds
Stripping the margin out gives you the market’s view of the probabilities with the commercial loading removed. This is a descriptive exercise — it tells you what the prices imply, not what will happen — and it is the step that turns a quoted price into something you can compare against your own reasoning.
The simplest approach is proportional normalisation: divide each implied probability by the book total. Using the opening two-way example, where the book totalled 104.64%, the first side becomes 54.64 ÷ 104.64 = 52.22% and the second becomes 50.00 ÷ 104.64 = 47.78%. Those two now add to exactly 100%. Convert back to decimal by dividing one by each figure and you get margin-free prices of about 1.92 and 2.09 against the 1.83 and 2.00 on offer.
Seeing those four numbers side by side is the moment the arithmetic stops being theoretical. You are being offered 1.83 on something the market itself treats as a 1.92 shot. That shortfall, repeated on every bet in every market, is the entire story of why sustained betting trends negative regardless of how well you read a pitch.
Proportional normalisation has a known weakness worth stating honestly, since most pages on bookmaker margin explained omit it. It assumes the margin is spread evenly across outcomes in proportion to their probability, and in practice it generally is not. Bookmakers are widely observed to load more of the margin onto longshots, where public money tends to concentrate and where pricing error is cheapest to hide. More sophisticated methods — subtracting the margin in equal percentage-point shares, or fitting a model that weights longshots differently — produce different fair prices from the same input. None of them is definitively correct. Proportional is the reasonable default because it is transparent and reproducible, not because it is exact.
- Proportional: divide each implied probability by the book total. Simple, assumes even loading.
- Equal-margin: subtract the same number of percentage points from each outcome. Distorts short prices badly.
- Longshot-weighted: removes more margin from long prices than short ones. Closer to observed behaviour, but requires assumptions you cannot verify.
- Practical takeaway: the removed figures are an estimate with an error bar, not a measurement. Treat the third decimal place as noise.
Implied probability is not true probability
This distinction is the one that does the most damage when it is missed. Implied probability is a number you extract from a price. True probability is the actual long-run frequency of an outcome, and nobody knows it — not you, not the bookmaker, not the analyst on the broadcast. A cricket match is played once. There is no repeated trial to measure.
So the implied probability sitting inside any price is a composite of several things at once: the bookmaker’s genuine estimate of the chance, the margin loaded on top of it, and an adjustment for where the money has already gone. If heavy volume arrives on one side, prices move to manage the liability, which shifts the implied probability without anybody’s view of the cricket having changed at all. The number on your screen is partly an opinion about the match and partly a record of other people’s betting.
The reason the implied figures are nonetheless taken seriously is that in liquid markets they tend to be reasonably well calibrated. Across a very large number of fixtures, outcomes priced at a margin-free 40% land somewhere close to 40% of the time. That is a statement about the aggregate and a very weak one about any single match. Calibration over a large sample tells you nothing about whether tonight’s price is right, which is precisely the inference people most want to draw from it and cannot.
There is a practical consequence. If you want to know whether your own reading of a market has been any good, the only instrument that works is a complete record of what you bet, at what price, and how it settled — compared against the margin-free implied probabilities at the time. Without that, memory does the accounting, and memory is systematically kind. Our notes on keeping a usable record of cricket betting activity cover what to log and why incomplete records flatter the person keeping them. Three months of honest entries will tell you more than any amount of reasoning about individual prices.
Mistakes to avoid when reading the margin
These are the errors that recur most often once people start calculating overround for themselves. Most of them cause the margin to look smaller than it is, which is a convenient direction for the error to run in.
- Leaving an outcome out of the book. Pricing a Test match on two outcomes instead of three understates the overround dramatically. Count the outcomes before you divide anything.
- Confusing overround with margin. 4.64 percentage points of overround is a 4.43% margin. Quoting the first as the second overstates the cost slightly and makes comparisons unreliable.
- Assuming one market’s margin applies to the whole board. The match-winner price is usually the tightest thing on the screen. Side markets and props are routinely several times wider.
- Treating margin-free odds as a forecast. Removing the margin reveals what the market implies, not what will happen. The removal method itself carries assumptions you cannot test.
- Thinking the margin can be outlasted. It applies to every bet placed, so more volume means more exposure to it, not less. There is no sequence, stake pattern or selection method that converts a negative expectation into a positive one — the margin is not a variable you get to influence.
- Reading a tight margin as a good deal. A 2% margin is still a 2% cost on turnover. Lower is cheaper, and cheaper is not free.
- Mixing formats mid-calculation. Converting two prices from decimal and one from fractional without checking your arithmetic is an easy way to produce a book total that is wrong by a point or two. Put everything in decimal first, then divide.
The honest summary of bookmaker margin explained at this level of detail is that the arithmetic is genuinely simple and genuinely unavoidable. You can measure it precisely, compare it across markets, and strip it out to see what prices imply. What you cannot do is make it stop applying to you. Losses are the expected outcome of sustained real-money betting, and the margin is the mechanism that makes that true. Betting is for adults only and carries real financial risk; if it has stopped feeling like a cost you chose, the National Council on Problem Gambling lists free help and treatment options. Nothing in this breakdown changes the direction the maths points in — it only makes the size of the cost visible.
Frequently Asked Questions
What is implied probability in betting odds?
Implied probability is the chance of an outcome as expressed by its price. For decimal odds, divide one by the price and multiply by one hundred: 2.50 becomes 40%, 1.50 becomes 66.67%. It is the bookmaker’s stated view of the outcome with the commercial margin still included, so it is not a clean estimate of the real chance.
How do I calculate a bookmaker’s margin?
List every outcome in the market, convert each decimal price to implied probability, and add them up. Subtract 100 from that total to get the overround in percentage points, then divide the overround by the book total to get the margin as a percentage of turnover. A book totalling 105.56% has 5.56 points of overround and a 5.26% margin.
Why do implied probabilities add up to more than 100%?
Because the bookmaker sells slightly more probability than exists. Real probabilities across a complete market must total exactly 100%, since one outcome has to occur. Prices are set so the reciprocals total more than that, which means the promised payouts are collectively smaller than the stakes accepted. The excess is the commercial margin, not a statement about the match.
What is a typical overround on a cricket match?
Headline two-way match-winner markets on well-attended limited-overs fixtures commonly sit around 2% to 6%. Three-way Test result markets usually run wider, roughly 4% to 8%. Multi-selection markets such as top batter can exceed 10% to 20% because each of the many selections carries its own shading. In-play markets widen to cover fast price movement. These are commonly observed ranges, not published standards.
Is implied probability the same as true probability?
No. Implied probability is extracted from a price and contains the bookmaker’s estimate, the margin, and an adjustment for where money has already been staked. True probability is the actual long-run frequency, which nobody knows for a one-off match. Margin-free implied figures tend to be reasonably well calibrated across a very large sample of fixtures but say very little about any single game.
How do I remove the margin from odds?
The standard method is proportional normalisation: divide each outcome’s implied probability by the book total so the set sums to 100%, then convert back to decimal by dividing one by each result. In a book totalling 104.64%, a 54.64% implied chance becomes 52.22%, or about 1.92 in decimal. The method assumes the margin is spread evenly, which in practice it generally is not.