Betting variance explained in one sentence: variance is the spread of individual outcomes around the long-run average, and it is the reason two people making identical bets at identical stakes with identical discipline can finish a month hundreds of units apart. Most writing on the subject sits at one of two extremes — dense academic notation, or marketing copy that uses “high volatility” as a selling point for a product. Neither helps you read your own numbers. What follows is the plain arithmetic: where swings come from, why a short run of results tells you almost nothing, what stake size really changes, and why the margin still ends up deciding the story. 18+. Real-money play carries risk, and a loss is the expected outcome over time.
Table of Contents
Betting variance explained: the short answer
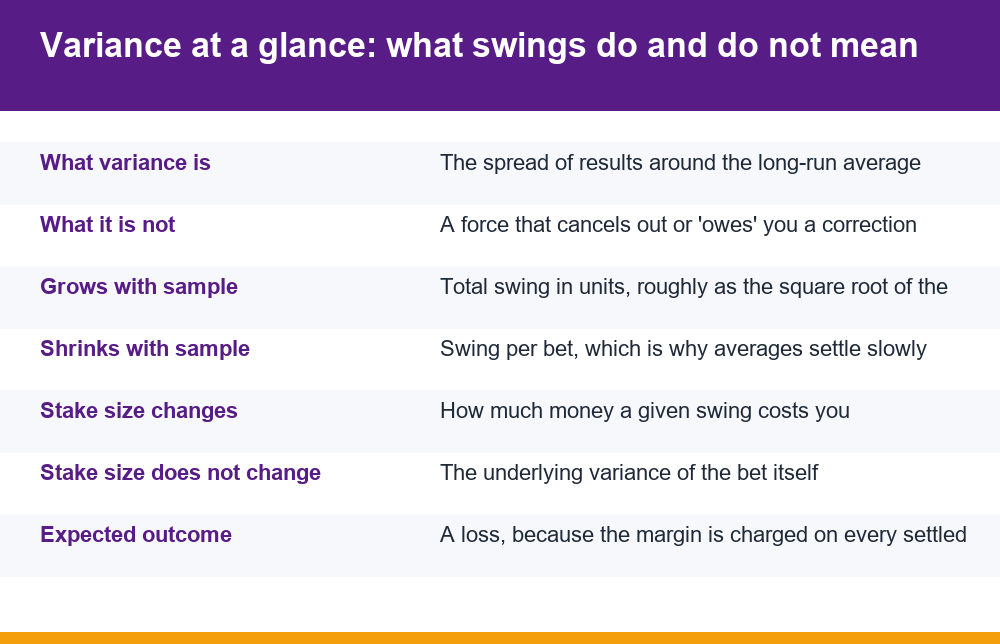
Every settled bet has two separate properties. The first is its expected value — the average amount you gain or lose per bet if you could repeat it forever. The second is its variance — how far individual results scatter around that average. Expected value tells you where the line is heading. Variance tells you how wide the band around that line is at any given moment.
With betting variance explained this way, the two most common confusions dissolve. A run of wins does not mean the expected value changed; it means you sampled the upper part of a wide band. A long losing stretch does not mean anything is broken; it means you sampled the lower part. Neither result is evidence about the underlying numbers unless the sample is large enough to drown out the scatter — and for most realistic betting volumes, it is not.
The uncomfortable part is the interaction between the two. The size of a typical swing grows roughly with the square root of the number of bets, while the margin charged against you grows in a straight line with the number of bets. Early on, the swing is loud enough to hide the margin completely. Later, the margin is loud enough to swallow the swing. That single asymmetry explains almost everything people find mysterious about their own records.
It is worth being blunt about what this does and does not imply. It does not imply that a losing stretch will be repaid, or that a winning stretch is a reward for better reasoning. It implies something narrower and more useful: that the number you see on your own ledger today is one sample from a range of plausible numbers, and that the range is usually far wider than intuition suggests. Everything below is an attempt to put a size on that range so you can read your own figures without over-interpreting them.
What variance actually means when you read results
Formally, variance is the average of the squared distances between each result and the mean result. The squaring is a technicality — it stops positive and negative deviations cancelling each other out — but it makes the raw number hard to interpret, which is why most people work with the square root instead. That square root is the standard deviation, and it is measured in the same units as your stakes, so it can be read directly.
For an even-money bet settled at roughly a coin-flip frequency, the standard deviation of a single one-unit bet is close to one unit. That is a useful anchor. It means a single bet’s outcome routinely sits a full unit away from its average, while the average itself may only be a few hundredths of a unit below zero. The noise is dozens of times larger than the signal on any individual bet.
There is one further piece of arithmetic that does most of the work later on. For bets whose outcomes are independent of each other, variances add up: the variance of a hundred bets is a hundred times the variance of one. Because standard deviation is the square root of variance, the standard deviation of a hundred bets is only ten times that of one bet — not a hundred times. That is the entire origin of the square-root behaviour. Totals get noisier as you add bets, but much more slowly than the totals themselves grow.
Three practical consequences follow from that ratio:
- A single result carries no information. One win or one loss is indistinguishable from noise, regardless of how confident the reasoning behind it felt.
- Short sequences are nearly as uninformative. Ten or twenty bets produce a result range so wide that almost any outcome fits comfortably inside it.
- Your memory samples badly. Unusual outcomes are the ones you recall, which systematically distorts any mental estimate of how you are actually doing.
The independence assumption deserves a footnote, because it is not always safe. Bets on correlated outcomes — several markets inside the same match, or a multiple that needs every leg to land — do not behave like separate bets. Their variances do not simply add, and the combined swing can be considerably larger than the count of bets would suggest. Anything that bundles outcomes together concentrates the result rather than spreading it, which pushes the band wider, not narrower.
This is also why the only reliable account of your own results is a written one. A ledger that records stake, odds, date and settled outcome for every bet is the difference between measuring variance and guessing at it. The practical mechanics of building one are covered in our breakdown of how to keep betting records that actually survive scrutiny, and the discipline matters far more than the spreadsheet software you choose.
Variance, volatility and standard deviation compared
These three words are used almost interchangeably in everyday betting conversation, and in loose terms that is acceptable — they all point at the same idea of outcome spread. But they are not identical, and the differences occasionally matter when you are comparing two things.
| Term | What it measures | Units | Everyday use |
|---|---|---|---|
| Variance | Average squared deviation from the mean | Units squared | Rare in conversation; used in formulas |
| Standard deviation | Square root of variance | Same units as your stake | The number worth quoting; directly comparable to a bankroll |
| Volatility | Informal word for spread, often per unit of time | Varies by context | Common in product marketing, loosely defined |
| Range | Highest minus lowest observed result | Same units as your stake | Easy to read, but grows with sample size and is easily distorted by one outlier |
The one to be sceptical about is volatility, because it is the term most often used without a definition attached. When a product is described as high volatility, that is a statement about the shape of its outcome distribution — infrequent large payouts rather than frequent small ones — and it says nothing whatsoever about whether the average outcome is better or worse. Two products can have wildly different volatility and an identical margin against the player. The spread is a feature of the experience; the margin is what determines the long-run cost.
Standard deviation is the version worth internalising, simply because it shares units with your bankroll. If a thousand one-unit bets carry a standard deviation of about thirty-two units, that figure is immediately comparable to the size of the bankroll you are exposing. Variance in squared units is not.
One more distinction is worth keeping straight: spread and shape are different things. Two sets of bets can share a standard deviation and still feel nothing alike. A market that produces small frequent losses punctuated by a rare large win is lopsided — most individual results sit slightly below the average, with the average held up by the occasional outlier. A near even-money market is far more symmetric. The standard deviation does not distinguish between those two patterns, which is why a single number never fully describes what a sequence of results will feel like to live through.
Same expected value, very different bankroll paths
Here is the heart of the matter, and the part that marketing copy and academic papers both tend to skip. Two bettors with precisely the same expected value per bet, the same stake and the same number of bets can end up in completely different places — not because one was smarter, but because the band of plausible outcomes is wide.
The table below works through even-money one-unit bets carrying a five per cent margin against the player. The expected result is a straight-line loss of five per cent of total turnover. The standard deviation of the total grows as the square root of the number of bets, which is roughly one unit times the square root of the count. Everything here is arithmetic, not an estimate or a claim about any particular market.
| Number of bets | Expected result (units) | One standard deviation | Typical band (±1 SD) |
|---|---|---|---|
| 10 | -0.5 | ±3.2 | -3.7 to +2.7 |
| 100 | -5 | ±10 | -15 to +5 |
| 1,000 | -50 | ±31.6 | -81.6 to -18.4 |
| 10,000 | -500 | ±100 | -600 to -400 |
| 100,000 | -5,000 | ±316 | -5,316 to -4,684 |
Read down the final column and the whole story is visible at once. At ten bets a profit is entirely ordinary. At a hundred bets a profit still sits comfortably inside one standard deviation. By a thousand bets, a profit requires an outcome more than one and a half standard deviations above expectation — unusual, but far from impossible. By ten thousand bets, the entire plausible band sits below zero. No amount of discipline moved the band; only volume did.
Notice what happens to the two columns relative to each other. Between a hundred bets and a hundred thousand, the expected loss multiplies by a thousand while the standard deviation multiplies by only about thirty-two. In proportional terms the swing shrinks the whole time: at a hundred bets the standard deviation is twice the expected loss, and at a hundred thousand it is about a sixteenth of it. Nothing dramatic happens at any particular row. The margin simply out-grows the noise, steadily and without exception.
With betting variance explained in this format, the standard objection answers itself. People who insist a system works are almost always describing a sample from the first two rows of that table, where positive results are routine and prove nothing. The band does not care about the quality of the reasoning that selected the bets — it only widens or narrows with the count.
The margin in that calculation is not a rounding error. It is the mechanism, applied to every settled bet whether it wins or loses, and it is set out in detail in our explainer on how the house edge is built into the price you accept. Variance decides which path you travel; the margin decides where every path eventually leads.
Why a losing month happens even with disciplined staking
Disciplined staking is a genuinely good habit, but it is frequently misunderstood as a protection against losing stretches. It is not. Flat staking, fixed percentages and hard session limits all control how much a swing costs you. None of them reduce the probability that a swing happens, because that probability is a property of the bets themselves.
Consider a month of three hundred one-unit bets at even money. Expected result at a five per cent margin: a fifteen-unit loss. Standard deviation: roughly seventeen units. That means a result anywhere from about minus thirty-two to plus two is inside a single standard deviation, and roughly a third of all months would be expected to land outside that band in one direction or the other. A month that finishes fifty units down is not evidence of a catastrophe. It is a normal tail outcome, and it would still be a normal tail outcome if every decision made during it had been impeccable.
The same arithmetic also explains the inverse case, which gets far less attention. A month that finishes fifteen units up, against an expected fifteen-unit loss, is a swing of thirty units — under two standard deviations, and therefore unremarkable. A month like that is not confirmation of anything either, even though it feels like confirmation of everything. Positive tails and negative tails are produced by exactly the same mechanism, and neither is informative on its own.
What that implies for planning is unglamorous but important. If you are allocating a bankroll across several events or a tournament season, the figure that matters is not the expected loss but the size of the swing you would need to absorb without being forced to stop early. Our walkthrough on spreading a bankroll across a multi-tournament calendar works through why the swing, not the average, is the number that sets the limit.
There is a second, quieter effect worth naming. Because losing stretches feel like evidence of a mistake, they create pressure to change something — stake size, selection approach, market. Each change restarts the sample. A record made up of a dozen abandoned approaches, none with enough bets to mean anything, is a record from which nothing can be learned at all. Betting variance explained properly is partly a defence against that churn.
Does lowering stake size reduce variance?
This is the single most common misunderstanding, and the honest answer has two halves that pull in opposite directions.
In absolute money terms, yes. Halve your stake and you halve the standard deviation of your results measured in currency. A swing that was going to cost sixty units now costs thirty. If your concern is the size of the hole a bad run can dig, smaller stakes are a direct and effective lever — probably the only genuinely effective one available.
In relative terms, no. Measured in units of stake, the variance of the bet is completely unchanged. The same proportion of outcomes land in the same places. The shape of the distribution is identical; you have simply changed the scale on the axis. And because the margin scales down with the stake too, the expected loss shrinks in exactly the same proportion as the swing does. The ratio between them — which is what determines how long it takes for the margin to become visible — does not move at all.
So the accurate statement is this: stake size controls your exposure, not the game. It changes how much a given run of results costs you in money. It does not make a losing run less likely, does not shorten the time needed for averages to settle, and does not alter the direction the band is travelling.
A related confusion involves bet count rather than bet size. Splitting a given amount of money across more, smaller bets does narrow the band around the final figure in proportional terms, because the swing grows with the square root of the count while turnover grows with the count itself. That is a real effect and it is often described as reducing variance. What it actually does is make the outcome more predictable — and since the expected outcome is a loss, a more predictable outcome means a result closer to that loss, not further from it. Narrowing the band around a negative average is not an improvement; it simply removes the possibility of being lucky.
The same logic applies in reverse to every staking scheme built on increasing stakes after losses. Larger stakes after a loss raise the money at risk while leaving the underlying variance and the margin untouched. The arithmetic does not reward the pattern; it just amplifies it.
How many bets before results reflect the average
There is no single threshold, but there is a clean way to think about it. Ask how many bets are needed before the expected result is larger than one standard deviation of the total. Below that point, noise dominates and your observed result is mostly a sample from the band. Above it, the average starts to show through clearly.
For the five per cent even-money example used throughout, the expected loss after n bets is 0.05n and the standard deviation is about the square root of n. Setting those equal gives n = 400. So at roughly four hundred bets the margin and the noise are the same size — which means that even at four hundred bets, a breakeven or slightly positive result remains entirely ordinary. For the margin to be two standard deviations clear, you need around sixteen hundred bets. For three, around thirty-six hundred.
A few things follow from that calculation:
- Smaller margins need far larger samples. Halve the margin and the bets required to see it quadruple, because the threshold scales with the inverse square of the edge.
- Higher-variance bets need larger samples still. A market where single outcomes swing several units instead of one pushes the crossover point out by the square of that multiple.
- Most personal records are too short to conclude anything. A few hundred bets across mixed markets and mixed stakes will not separate skill, luck and margin, no matter how carefully it is tabulated.
- Mixing markets makes it worse, not better. Combining bets with different variances and different margins into one running total produces a number that is not a meaningful average of anything.
It is worth putting those counts into calendar terms, because the abstraction hides how demanding they are. Sixteen hundred settled bets at ten bets a week is roughly three years of continuous activity, with no change of market, no change of stake and no gaps — and three years of unchanged behaviour is rare. In practice almost nobody accumulates a clean sample of that size. The realistic position is therefore not “my records are inconclusive for now” but “my records will probably remain inconclusive”, which is a different and more honest conclusion to sit with.
This is why honest record-keeping leads to a modest conclusion rather than a confident one. The realistic output of a well-kept ledger is not proof that an approach works — it is a clear-eyed measurement of how much you have staked, how much you have lost, and how wide the band around that figure still is.
Is high variance always bad?
Not inherently. Variance is a neutral property, in the same way that the width of a road is neutral. What matters is the direction of travel and whether your bankroll can survive the detours. High variance is the thing that makes an occasional large positive result possible, and it is also the thing that makes a long drawdown possible. It cuts both ways by definition, because it is symmetry around the average, not a bias.
Where high variance becomes genuinely harmful is in its interaction with three other factors. First, with a negative average: a wide band around a downward line still ends up down, it just takes longer to become obvious, which extends the period in which someone can believe the opposite. Second, with limited bankroll: a swing larger than the money available ends the sequence regardless of what the long-run average would have been. Third, with human psychology: wide bands produce vivid wins and vivid losses, and vivid outcomes are precisely the ones that drive escalating behaviour.
The second of those is worth spelling out, because it is the one people underestimate most reliably. A bankroll is not just a quantity of money; it is a floor, and hitting the floor stops the sequence permanently. That matters because the long-run average only describes what happens to someone who gets to keep playing. Anyone whose funds run out during a downswing never reaches the long run at all — their result is fixed at the worst point they passed through, not at the average. The wider the band, the more likely it is that the floor arrives first.
That third interaction is the one to take seriously. The arithmetic on this page is the same arithmetic whether someone stakes small amounts for entertainment or stakes money they need. What differs is the consequence of landing in the lower tail, and the lower tail is not avoidable. If the swings have started dictating decisions — chasing a losing run, staking borrowed money, hiding the size of the activity — that is a signal independent of any calculation, and free confidential support exists for it. GamCare’s free and confidential support service sets out what help is available and how to reach it.
The short version: high variance is not worse than low variance in terms of the average result. It is worse in terms of how long it takes to see the truth, and how much damage the journey can do along the way.
Variance mistakes to avoid when reading your own records
Most errors in interpreting betting results are variance errors wearing a different hat. The checklist below covers the ones that recur most often, and each is a reasoning failure rather than a maths failure.
- Treating a hot streak as a changed edge. Nothing about the underlying numbers changed. You observed the upper part of a band that was always there.
- Expecting balance to arrive. Outcomes do not compensate for earlier ones. Independent events have no memory, and the apparent settling of averages over time comes from dilution by new results, not from correction of old ones.
- Reading a running total as a verdict. A cumulative profit-and-loss line is a single sampled path, not the distribution. Drawing a conclusion from its current endpoint is drawing a conclusion from one data point.
- Changing approach mid-sample. Every change resets the count and guarantees that no segment is long enough to be informative.
- Confusing a small margin with no margin. A margin too small to see in a few hundred bets is still charged on every single one of them.
- Assuming a bigger bankroll beats variance. A larger bankroll buys more time inside the band. It does not change the direction the band is travelling.
- Mistaking low variance for safety. Low-variance activity with a negative average produces a steadier, more predictable loss — not a smaller one per unit staked.
- Counting stakes instead of turnover. The margin is charged on everything settled, so a small bankroll recycled many times is exposed to far more margin than its size suggests.
One further habit is worth naming because it masquerades as rigour: recording only the results you consider representative. Discarding bets placed carelessly, or periods when attention slipped, produces a tidier ledger and a meaningless one. Selective records always flatter, because the exclusions are chosen after the outcomes are known. A record is only a measurement if everything settled goes into it.
What all of this adds up to is a fairly plain position. Variance is why short-run results are unreadable, and the margin is why long-run results are not. Understanding the first protects you from false conclusions in both directions; understanding the second tells you what the realistic outcome of sustained real-money play is. No staking pattern, selection method or bankroll size alters either, and anyone claiming otherwise is describing a sample too small to support the claim.
Keep a record, know the size of the swing you can absorb, and treat any run of results shorter than a few thousand bets as a story rather than evidence. That is the whole of the practical position that betting variance explained in honest numbers actually supports.
Frequently Asked Questions
What does variance mean in betting?
Variance is the spread of individual outcomes around the long-run average. Expected value tells you where your results are heading; variance tells you how wide the band of plausible results around that line is. For a one-unit even-money bet the standard deviation is close to one unit, while the average loss per bet may be only a few hundredths of a unit — so on any single bet the noise is dozens of times larger than the signal.
Is variance the same as volatility?
Not exactly, though they are used interchangeably in conversation. Variance is a defined statistical quantity — the average squared deviation from the mean — and its square root, the standard deviation, is measured in the same units as your stake. Volatility is an informal word for outcome spread with no fixed definition, often used in product marketing. Crucially, neither says anything about whether the average outcome is favourable; a high-volatility product and a low-volatility one can carry an identical margin.
Why can a losing month happen even with disciplined staking?
Because staking discipline controls how much a swing costs, not whether a swing happens. Three hundred one-unit even-money bets at a five per cent margin have an expected loss of fifteen units and a standard deviation of about seventeen units, so results from roughly minus thirty-two to plus two sit inside a single standard deviation. A month finishing fifty units down is a normal tail outcome and would remain one even if every individual decision had been sound.
Does lowering stake size reduce variance?
In money terms yes, in relative terms no. Halving your stake halves the standard deviation measured in currency, which directly reduces how much a bad run costs you. But measured in units of stake the variance of the bet is unchanged, and the expected loss shrinks by exactly the same proportion as the swing, so the ratio between them is identical. Stake size controls your exposure, not the game.
How many bets does it take before results reflect the average?
A useful benchmark is the point where the expected result exceeds one standard deviation of the total. With a five per cent margin on even-money bets, that crossover sits at about four hundred bets — and even there a breakeven result remains ordinary. Getting the margin two standard deviations clear of the noise takes around sixteen hundred bets, and three standard deviations around thirty-six hundred. Smaller margins and higher-variance markets push those figures up sharply.
Is high variance always bad?
Not in itself, because variance is symmetric around the average rather than biased in one direction. It becomes harmful through its interactions: paired with a negative average it simply delays the point at which the downward trend becomes obvious; paired with a limited bankroll a single large swing can end the sequence early, fixing the result at the worst point reached rather than the average; and paired with human psychology the vivid wins and losses it produces are what drive escalating behaviour. Low variance with a negative average is not safer — it just produces a steadier loss.